# Add filters to a dashboard
### Objective
In this tutorial, you will learn how to add filters to an existing dashboard in Toucan AI. Filters allow you to interact with the charts and control the data displayed based on specific criteria.
### Prerequisites
* A [dashboard already created](https://toucan-toco.gitbook.io/toucan-ai/build/dashboards-and-layouts/how-to/create-a-dashboard-with-ai) (see previous tutorials on how to create a dashboard).
* Charts added to your dashboard that you want to filter.
### Steps
#### 1. Access the Existing Dashboard
* From the **Home Page** of Toucan AI, navigate to the **Library** tab.
* Select the existing dashboard you want to add filters to. This will open the dashboard in the editing view.
#### 2. Add a New Filter
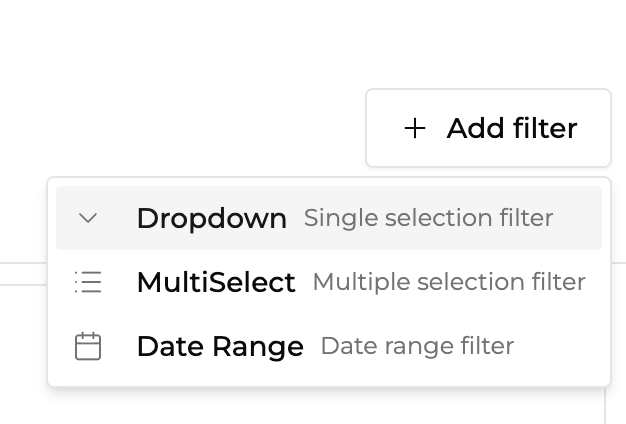
* In the top-right corner of the dashboard interface, click on the **Add Filter** button.
* You will be prompted to select the type of filter you want to use. Common filter types include:
* **Multi-select**: Allows multiple values to be selected from a list.
* **Dropdown**: Allows the selection of one value at a time.
* **Range**: Used for date data, allowing a range to be selected.
#### 3. Configure the Filter
* After selecting the filter type, give your filter a name.
* *For example, if you’re filtering by employee contract type, you could name the filter **Contract Type**.*
* Once named, you will see options to define which data this filter will affect. You’ll need to choose a **column** from the dataset that the filter will apply to. For example, you might select the **Contract Type** column for a filter related to employee contracts.
#### 4. Apply the Filter to the Dashboard
* After configuring the filter, it’s time to apply it to the charts on your dashboard.
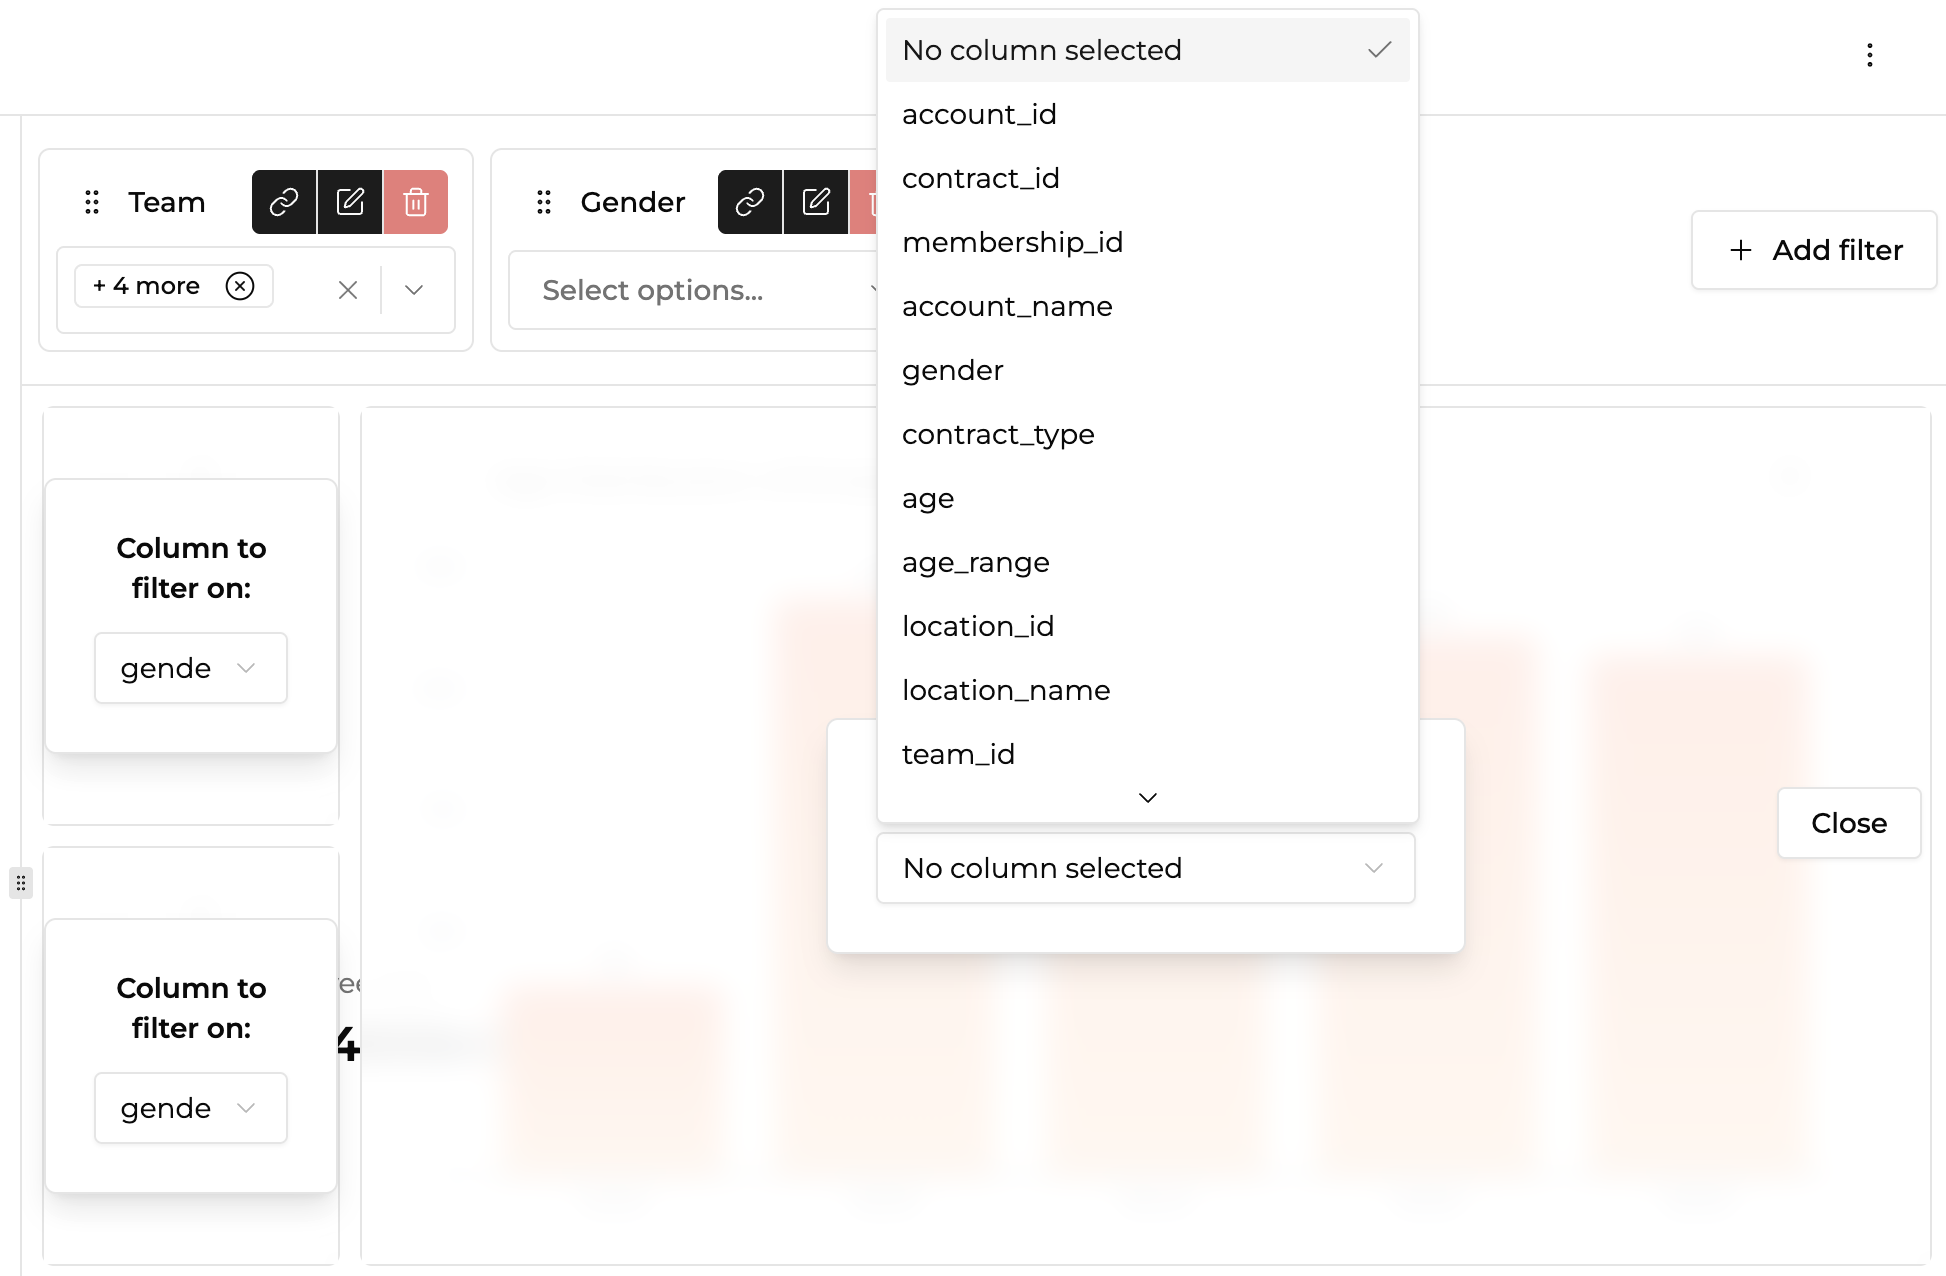
* Select the **Link Filter** icon next to the filter.
* Click on the charts you want to link the filter to. You can link the filter to multiple charts if needed.
* For each selected chart, a prompt will appear asking you to choose a **column to filter on**. Select the appropriate column, such as **Contract Type** for employee contract charts.
#### 5. Save and Finalize the Filter
* After linking the filter to your charts, click on the **Save** button to apply the changes.
* The filter will now be active on your dashboard, and you will be able to use it to dynamically control the data displayed in the linked charts.
#### 6. Test the Filter
* To ensure the filter is working correctly, interact with it by selecting different filter options.
* You should see the corresponding charts update based on the filter criteria you’ve set.
### Conclusion
Congratulations! You have successfully added a filter to your dashboard in Toucan AI. You can now interact with the filter to control how the data is displayed in your charts, enhancing the interactivity and usability of your dashboard.
**Suggested Next Steps**: [embed a dashboard](https://toucan-toco.gitbook.io/toucan-ai/embed/embedding-methods/how-to/embed-a-dashboard)!